Power BI: interactive reports and data visualisation in the V-Desk
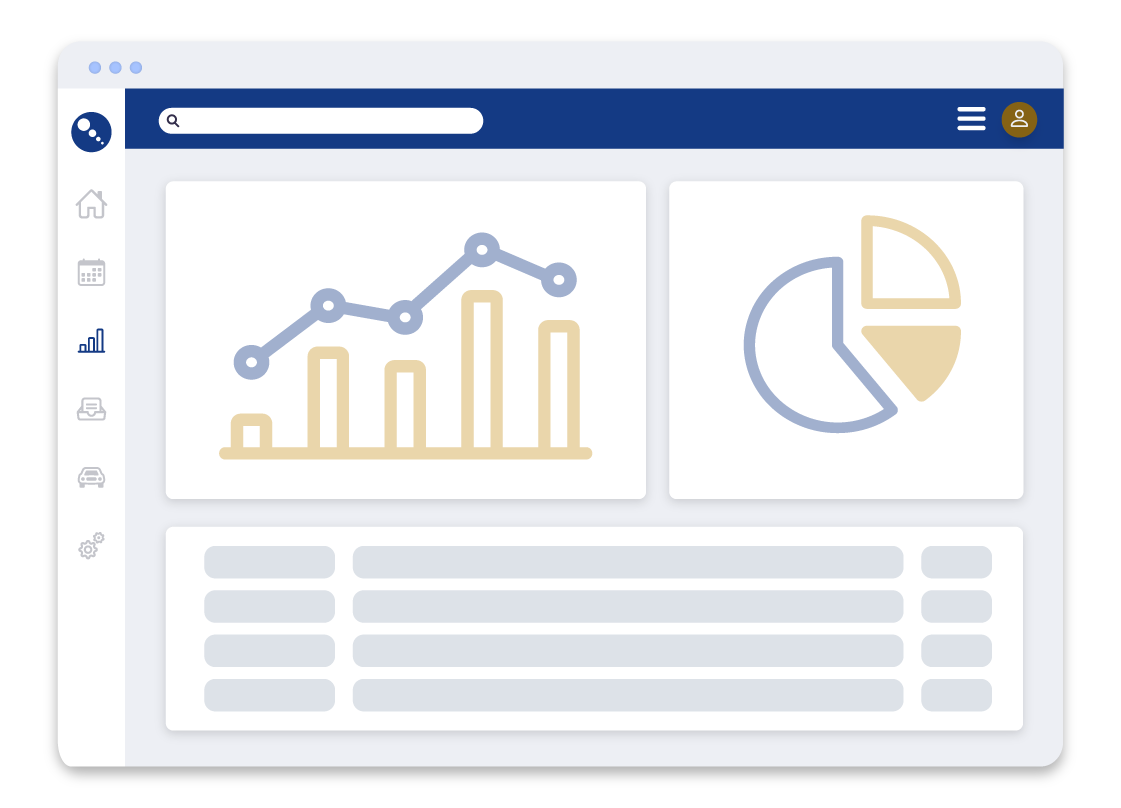
Power BI is the clear and transparent visualisation of data using a business intelligence tool directly on the V-Desk platform. Interactive reports are fed with data and transformed into analysis-friendly summaries and data models. Always up-to-date and cyclically refreshed reports can be made available according to the permissions granted. This tool is an analytical knowledge base, supporting strategic decision-making for both managers and every employee.
Benefit from attractively and accessibly presented data without purchasing a licence for an additional BI tool.
Do you know the pain points of data-driven decision-making?
Use of inefficient and costly analysis tools or lack thereof
The use of spreadsheets or other manually completed tools to compile and analyse data is a waste of time. Extracting and collecting relevant information takes time, consumes costs.
Power BI integrated with V-Desk automatically extracts interesting data and processes it into useful summaries
Barriers to sharing report data
The company uses analytics tools, but lacks a single convenient platform to share reports. This hinders communication and collaboration between company departments.
Power BI immersed in the V-Desk system not only retrieves and aggregates the indicated data, but also, by means of appropriately assigned permissions, allows access to shared reports to be managed. This provides valuable knowledge about the company almost at a glance.
Risk of decision-making delays
Decision-making must be based on up-to-date and consistent data. A lack of data analysis tools leads to delays in making good decisions.
Power BI provides the visualisation of data, bringing it together in interactive reports to support sound decision-making and allow you to react quickly to changing trends.
How does Power BI work in the V-Desk?
What will you improve by using Power BI on a V-Desk licence?
Transparent visualisation. You use a single platform that collects the data, processes it and shows you the finished statements in a form that is convenient for you, from traditional charts to graphical models.
Compilation and access to the most up-to-date data.
Access to a business intelligence tool without having to purchase a licence.
Remote access from anywhere. The application is available in a secure single tenant cloud solution.
Shortening the process of obtaining information, processing company data.
Insights into the organisation’s ecosystem in a single view.
Power BI embedded in V-Desk and V-Desk GA
The application can be used both off-the-shelf and in a dedicated model. The solution in V-Desk GA comes with ready-to-use predefined statements and functions, while individual customisation of tools is possible for specific needs.
V-Desk Power BI – FAQ
This solution will streamline the work of all departments that handle data and process it for further analysis. It will work well in the following areas of the company:
Financial planning, budgeting, forecasting, controlling, competition analysis, risk assessment, strategy, KPIs – performance indicators.
They can be used in their work by: management, risk department, controlling department, finance department, sales departments, marketing departments.
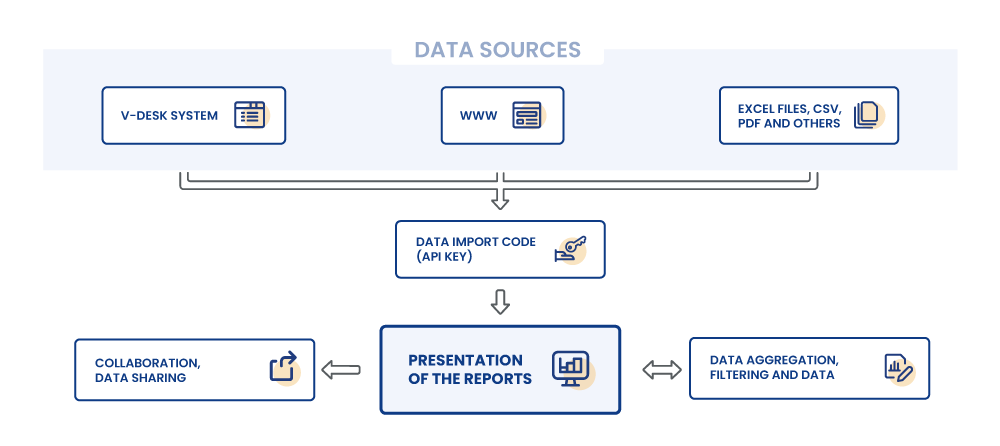
The data sources used to feed the application database can vary. It is important to run an appropriate data import code, the so-called API. Data can be taken from excel sheets, but also from web pages or directly from the V-Desk application.
